
 Download:


-
Since 2020, China has classified coronavirus disease 2019 (COVID-19) as a Category B infectious disease but managed it as a Category A disease, empowering local authorities to impose lockdowns and other stringent control measures (1). These COVID-19 control measures in China have persisted for nearly 3 years and may have far-reaching consequences for the healthcare system and other disease burdens. In January 2023, the Chinese government substantially adjusted its control policies, completely lifting COVID-19 interventions and resuming normal social and economic activities. The first COVID-19 case was confirmed in Jiangsu Province on January 22, 2020 (2). Several studies have shown that these measures are effective against COVID-19 and numerous other common infectious diseases, particularly respiratory and intestinal infections (3). Currently, the impacts of COVID-19 interventions on the spread of other respiratory and intestinal diseases in Jiangsu Province have been inconsistent.
Therefore, in this study, we established COVID-19 intervention models and counterfactual models of 9 respiratory and intestinal infectious diseases by adopting the seasonal autoregressive integrated moving average (SARIMA), neural network autoregression (NNAR), and hybrid models. We then compared the actual notification rate with the predicted rate and analyzed the impact of COVID-19 intervention measures in Jiangsu Province. This study aimed to provide a decision-making basis for the prevention and control of emerging infectious diseases.
-
Data on respiratory and intestinal infectious diseases between January 2004 and December 2023 in Jiangsu Province were obtained from the nationwide Notifiable Infectious Diseases Reporting Information System (NIDRIS). Based on the criterion of an annual average number of reported cases exceeding 250 from 2020 to 2022, a total of nine notifiable infectious diseases were identified for analysis: tuberculosis, influenza, mumps, scarlet fever, hepatitis A, dysentery, infectious diarrhoeal diseases other than cholera, dysentery, and typhoid/paratyphoid (OID), hand-foot-mouth disease (HFMD), and hepatitis E.
This study used the overall government response index from the Oxford COVID-19 Government Response Tracker (OxCGRT) to quantify COVID-19 interventions (4). This index tracks the strength and variation of all relevant indicators of government response from 2020 to 2022 on a scale of 0 to 100.
-
SARIMA, a variant of the ARIMA model, is expressed as SARIMA(p,d,q)(P,D,Q)s(5). The parametersp,d, andqrepresent the orders of autoregression, the degree of trend difference, and the moving average for the nonseasonal component, respectively.Psignifies the order of seasonal autoregression;D, the degree of seasonal difference;Q, the order of the seasonal moving average; ands, the seasonal period.
-
NNAR models can be conceptualized as a complex network of neurons or nodes, exhibiting intricate nonlinear interactions and functional forms. The model can be described with the notation NNAR(p,P,k)mfor seasonal data, whereprepresents the number of nonseasonal lagged inputs for the linear autoregressive (AR) model process,Pdenotes the seasonal lag for the AR model process,ksignifies the number of nodes in the hidden layer, andmis the length of the seasonal period (5).
-
A hybrid model was constructed by combining the SARIMA and NNAR models with equal weights.
-
We used a quantitative metric to evaluate and compare the performance of the models: MAPE. The formula used to calculate the metric is shown below (6):
$$ MAPE=\frac{1}{n}\sum _{t=1}^{n} \frac{\left|{y}_{t}-\widehat{{y}_{t}}\right|}{{y}_{t}} $$ where
$ {y}_{t} $ and$ \widehat{{y}_{t}} $ denote the original and predicted values at timet, respectively, andnis the number of predictions. A model with small mean absolute percentage error (MAPE) values is preferred. -
The SARMA, NNAR, and hybrid models were used to construct counterfactual models. Monthly case counts for each infectious disease from 2004 to 2017 served as the training set, while data from 2018 to 2019 served as the test set. The baseline models with the lowest MAPE values on the test set were selected and trained using data from 2004 to 2019 to predict case counts from 2020 to 2023.
-
Three models were constructed using monthly case counts for each infectious disease and overall government response indices. Data from 2004 to 2021 were used for model training and construction, while data from 2022 served as the test set to assess model performance. The best baseline models were selected based on the minimum MAPE value obtained from the test set. Subsequently, these models were trained using data from 2004 to 2022 to predict the number of cases in 2023 (
Supplementary Figure S1 ). -
The counterfactual models were neural network for tuberculosis, influenza, and OID; SARMA for mumps, scarlet fever, and HFMD; and hybrid for hepatitis A, dysentery, and hepatitis E. The intervention models were hybrid for tuberculosis, mumps, scarlet fever, dysentery, OID, HFMD, and hepatitis E; neural network for influenza; and SARIMA for hepatitis A. (
Supplementary Table S1 ) -
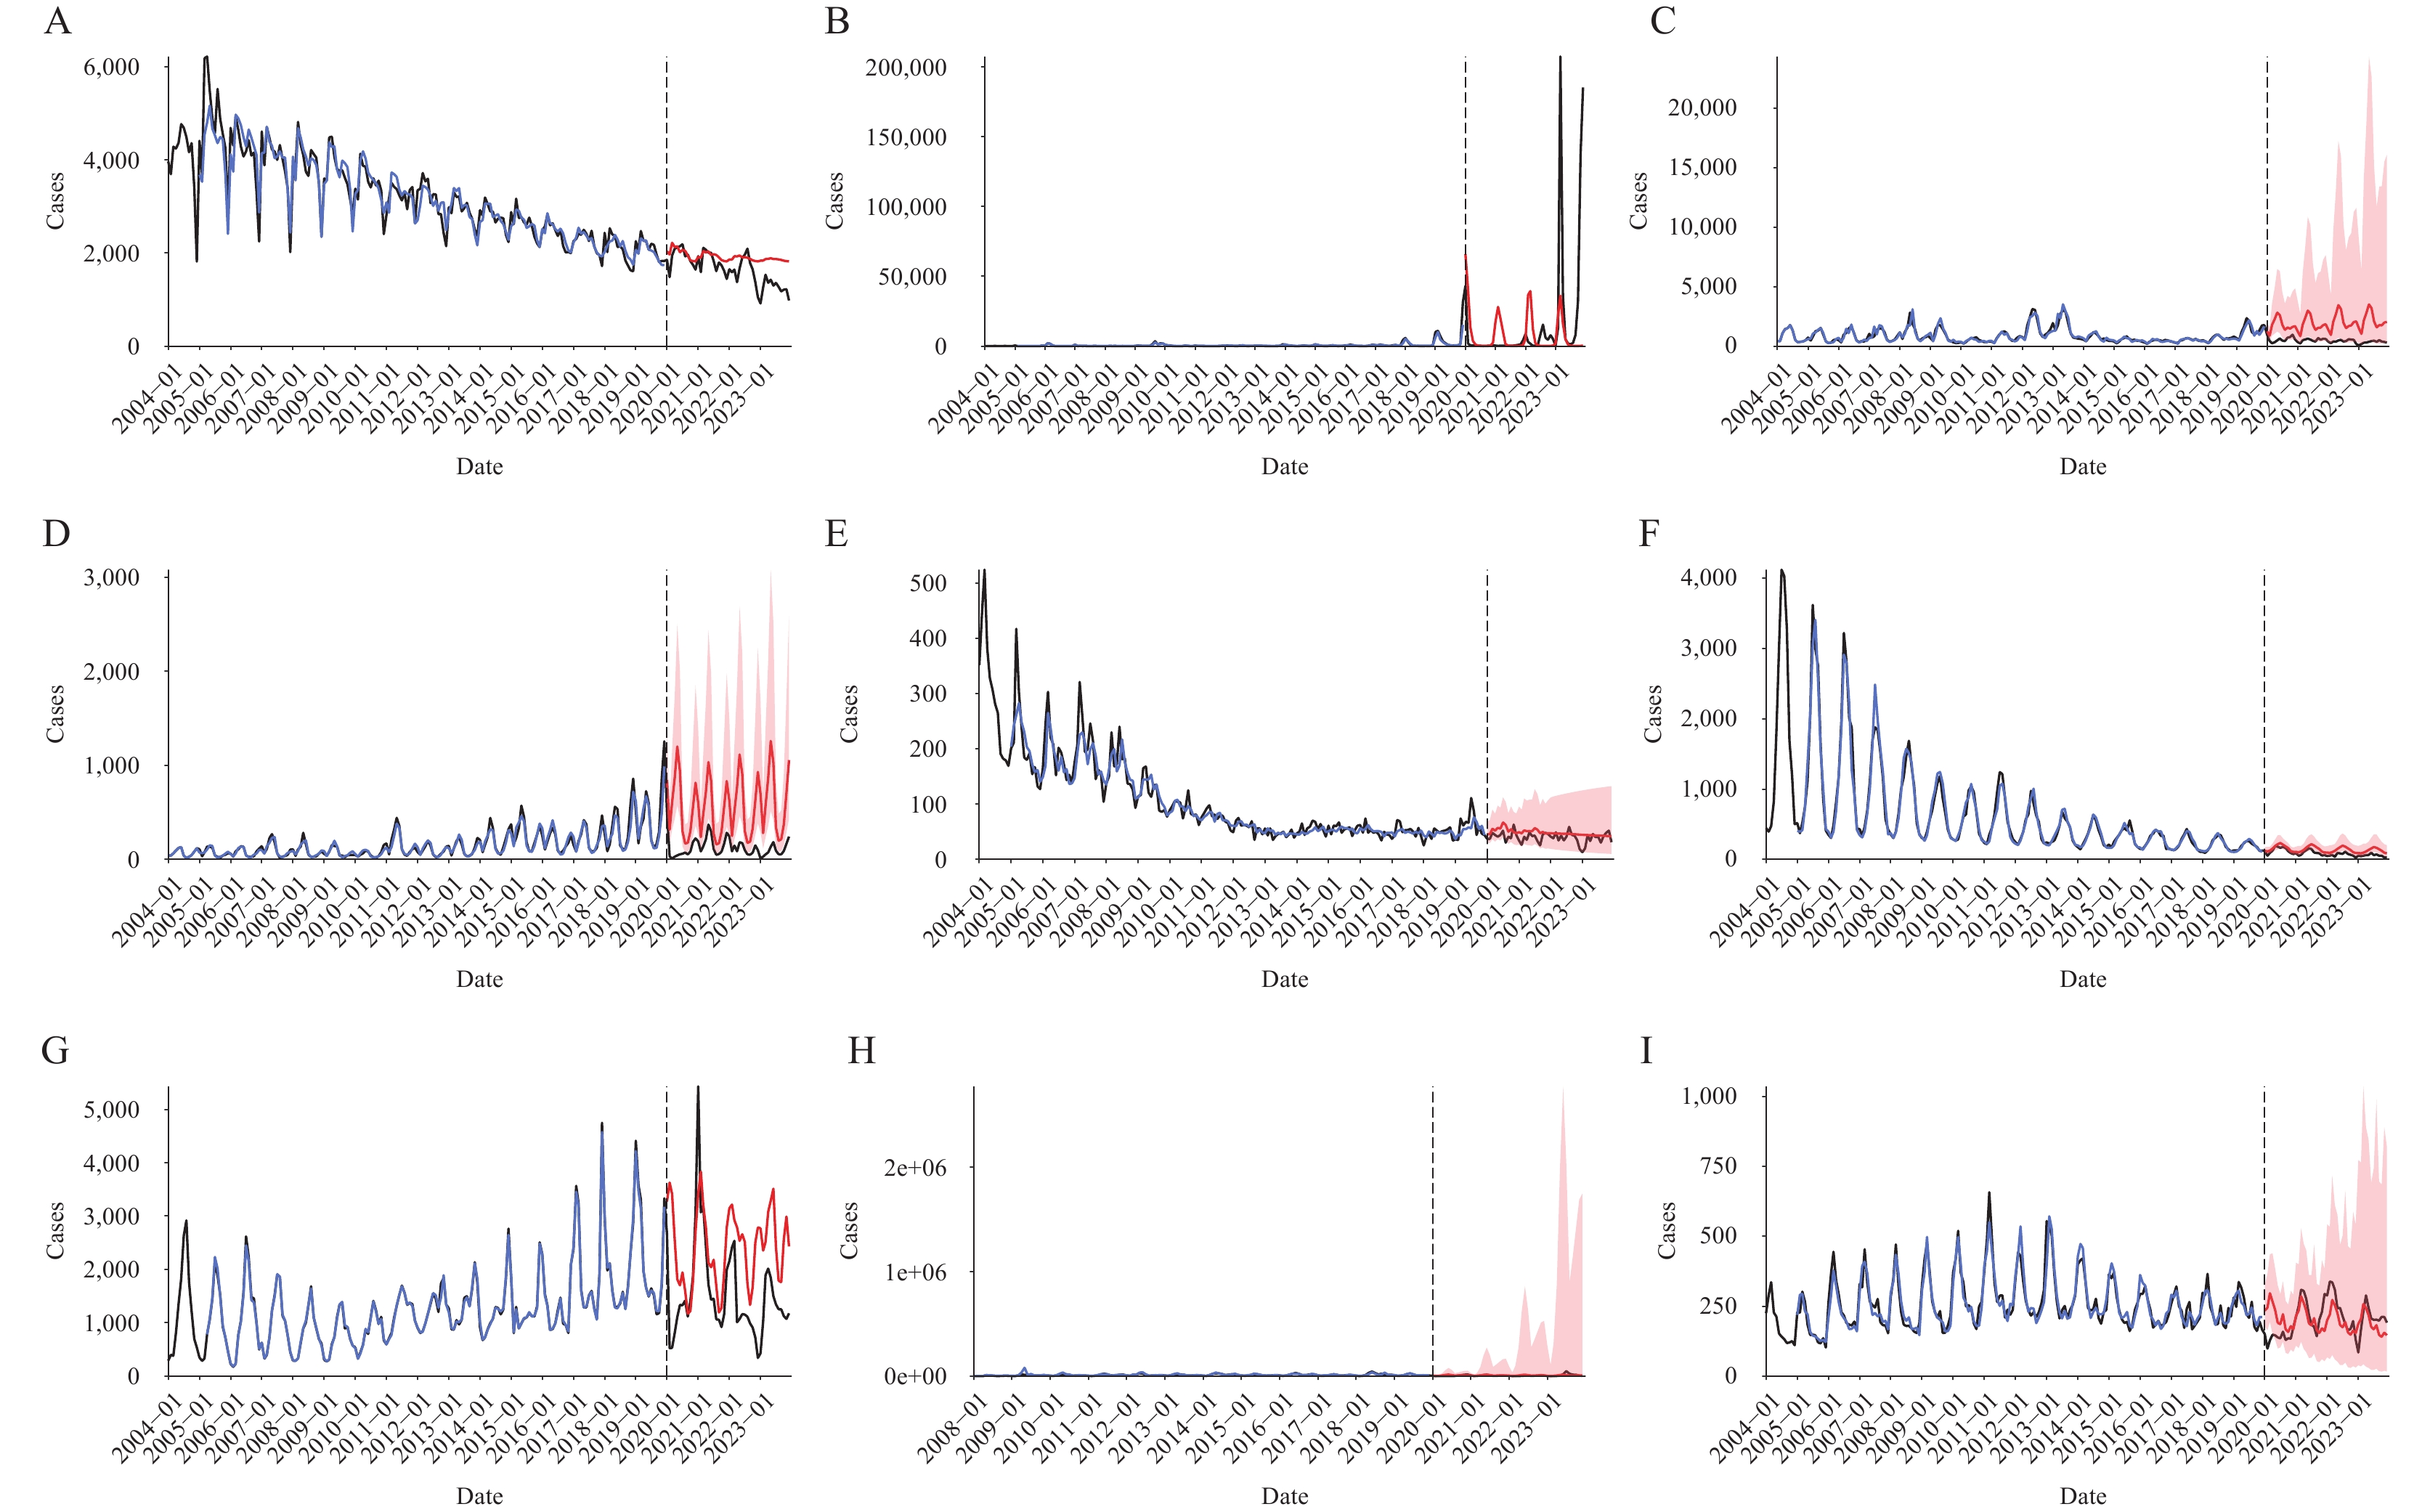
The actual yearly notification rates for 9 infectious diseases from 2020 to 2022 were lower than the rates predicted by the counterfactual models. The total relative change rates for the 9 infectious diseases, respiratory infections, and intestinal infections were −44.24%, −55.41%, and −26.59%, respectively. The three diseases with the highest relative change rates were scarlet fever (−75.90%), mumps (−73.35%), and influenza (−61.00%). (Figure 1andTable 1)
 Figure 1.
The observed notification rate versus the predicted notification rate based on 2020–2023 according to the counterfactual model. (A) Tuberculosis; (B) Influenza; (C) Mumps; (D) Scarlet fever; (E) Hepatitis A; (F) Dysentery; (G) OID; (H) HFMD; (I) Hepatitis E.
Note: The blue line represents the fitted values, the black line represents the actual values, and the red line along with the pink area represents the predicted values and the 95% confidence interval, respectively.
Abbreviation: OID=infectious diarrhoeal diseases other than cholera, dysentery, and typhoid/paratyphoid; HFMD=hand-foot-mouth disease.
Disease
categoryDiseases Counterfactual model Intervention model 2020–2022 2023 2023 cases
(n)Average
annual
incidence
(1/100,000)relative
change
rate of
incidence
(%)cases
(n)Annual
incidence
(1/100,000)relative
change
rate of
incidence
(%)cases
(n)Annual
incidence
(1/100,000)relative
change
rate of
incidence
(%)Respiratory Tuberculosis 69,823 27.87 −7.79 22,229 26.10 −32.46 20,661 24.26 −27.34 Influenza 304,717 121.64 −61.00 83,959 98.60 649.72 104,913 123.20 499.98 Mumps 67,543 26.96 −73.35 25,371 29.79 −84.35 4,738 5.56 −16.19 Scarlet fever 19,979 7.98 −75.90 7,577 8.90 −84.51 2,373 2.79 −50.53 Total 462,062 184.46 −55.41 139,136 163.39 366.89 132,685 155.82 389.59 Intestinal Hepatitis A 1,796 0.72 −18.44 517 0.61 −14.89 411 0.48 7.04 Dysentery 5,262 2.10 −34.49 1,452 1.71 −55.03 1,184 1.39 −44.85 OID 85,067 33.96 −32.22 31,469 36.96 −49.39 18,250 21.43 −12.73 HFMD 192,943 77.02 −24.95 58,830 69.09 110.24 72,341 84.95 70.97 Hepatitis E 7,348 2.93 −0.75 2,225 2.61 9.48 2,947 3.46 −17.34 Total 292,416 116.73 −26.59 94,493 110.97 51.48 95,133 111.72 50.46 Total 754,478 301.19 −44.24 233,629 274.36 239.32 227,818 267.54 247.98 Note: relative change rate of incidence=(actual incidence−predicted incidence)/predicited incidence. Table 1.The predicted yearly notification rate based on the counterfactual model and the intervention model from 2020 to 2023.
The total notification rates for 9 infectious diseases in 2023 predicted by the COVID-19 intervention model and the counterfactual model were similar (P=0.796).
-
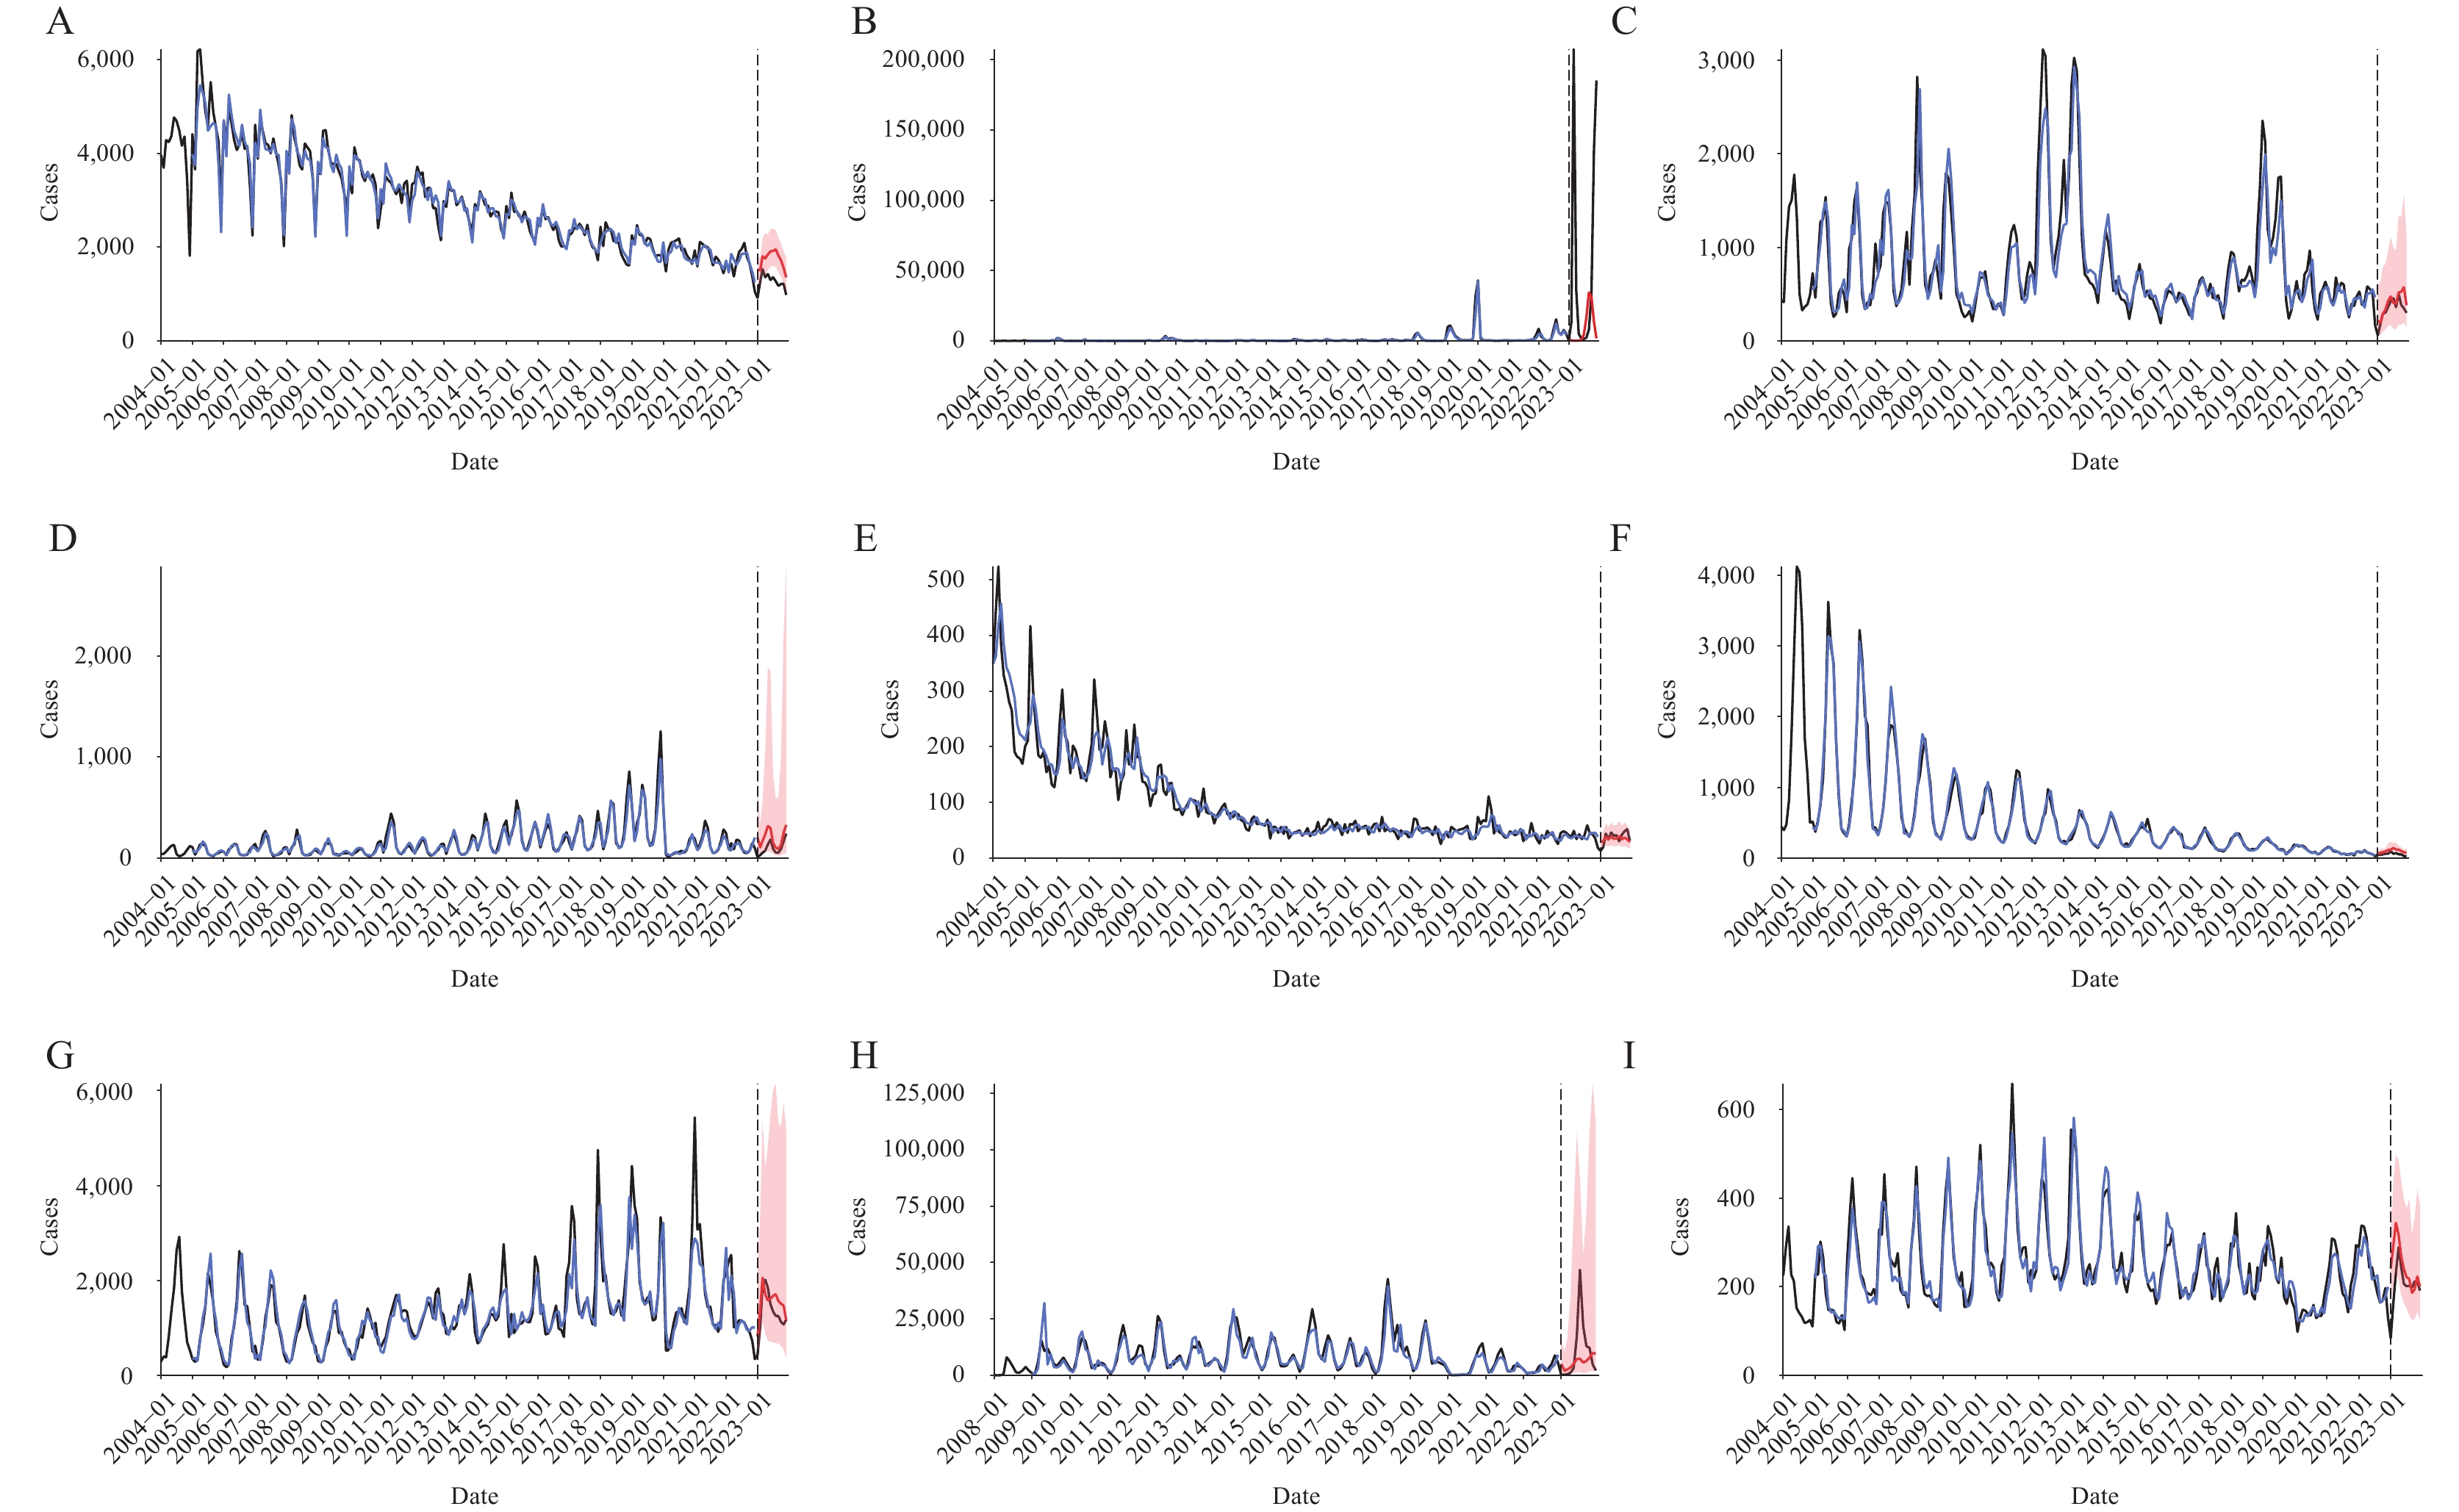
The actual yearly notification rate of 9 infectious diseases in 2023 was higher than the rate predicted by the COVID-19 intervention model, which incorporates the overall government response index to reflect changes in non-pharmaceutical interventions (NPIs). The total relative change rate for the 9 infectious diseases was +247.98%, with respiratory infections (+389.59%) and intestinal infections (+50.46%) showing increases. Three infectious diseases — influenza (+499.98%), HFMD (+70.97%), and hepatitis A (+7.04%) — showed a relative increase, while the remaining 6 infectious diseases showed a relative reduction (Figure 2andTable 1).
 Figure 2.
The observed notification rate versus the predicted notification rate based on 2023 according to the intervention model. (A) Tuberculosis; (B) Influenza; (C) Mumps; (D) Scarlet fever; (E) Hepatitis A; (F) Dysentery; (G) OID;(H) HFMD; (I) Hepatitis E.
Note: The blue line represents the fitted values, the black line represents the actual values, and the red line along with the pink area represents the predicted values and the 95% confidence interval, respectively.
Abbreviation: OID=infectious diarrhoeal diseases other than cholera, dysentery, and typhoid/paratyphoid; HFMD=hand-foot-mouth disease.
-
COVID-19 intervention measures effectively curbed the spread of respiratory and enteric infectious diseases in Jiangsu. We observed that the incidence of 9 infectious diseases declined compared to model predictions during 2020–2022, and the reduction in respiratory infectious diseases was greater than that in intestinal infectious diseases.
The lifting of NPIs did not result in a rebound of all infectious diseases; only influenza and HFMD infections were significantly higher than predicted by the intervention model. Similar observations have been reported in other countries. In late 2022, a surge in influenza and respiratory syncytial virus infections in the U.S. led to numerous reports (7). This wave of respiratory infections among children coincided with the easing of COVID-19 restrictions. Similarly, the incidence of HFMD rebounded in Japan as NPIs were relaxed (8). Based on current data, the observed rebounds or outbreaks following the easing of NPIs initially appeared in children and were all attributed to non-vaccine preventable diseases (non-VPDs) (9). However, given the potential decline in community immunity due to disruptions in vaccination programs during the COVID-19 pandemic (10), similar rebound trends observed for non-VPDs might also be anticipated for VPDs.
Some medical professionals and media outlets use the term “immune debt” to explain the surge in influenza and HFMD cases in 2023 (11), referring to the lack of pathogen exposure that leaves immune systems less prepared to fight these diseases. However, opponents argue that the immune system does not operate on a “use it or lose it” mechanism; even without exposure to pathogens, the human immune system maintains normal natural immunity (12). Indeed, several scholars have proposed new explanations for this phenomenon: the severe acute respiratorysyndrome virus 2 (SARS-CoV-2) virus damages the immune system through T-cell responses, weakening resistance to common infectious diseases (13). Immune dysfunction can persist for up to 8 months, even in patients with mild to moderate SARS-CoV-2 infection (14). However, further evidence is needed to confirm this viewpoint.
Most related studies have focused on assessing the impact of COVID-19 outbreaks and control measures on other infectious diseases during the early stages of lockdown or specific periods. This study encompasses the entire COVID-19 period and considers the dynamic changes in NIPs. We selected optimal models to improve prediction accuracy, retrospectively analyzed and compared case reports, and addressed inquiries regarding the magnitude of changes in respiratory and intestinal infectious diseases after the cancellation of the zero-clearing policy in a timely manner.
Our study has certain limitations. First, the lower number of reported cases of certain infectious diseases than predicted during the three-year COVID-19 intervention may reflect underreporting due to reluctance to seek medical care, potentially biasing reporting data and underestimating the actual incidence. Second, most OxCGRT data indicators are based on the strictest government policies implemented in a single country, which may limit the generalizability of our findings to other countries or regions with less stringent measures.
HTML
Data Source
Establishment of the SARIMA Model
Establishment of the NNAR Model
Establishment of The SARIMA-NNAR Hybrid Model
Model Evaluations


Constructing the Counterfactual Models
Constructing the COVID-19 Intervention Models
Selection of The Optimal Model
Predicted Yearly Notification Rates for 2020–2023 Based on Counterfactual Models
Predicted Yearly Notification Rates for 2023 Based on COVID-19 Intervention Models
| Citation: |

|