

 Download:


-
Human mobility restrictions have shown to be effective in mitigating the spread of severe acute respiratory syndrome coronavirus 2 (SARS-CoV-2) transmission (1–2). However, mobility restrictions disrupt social and economic activities (3–4), threatening fiscal revenues for national and local governments (5) and affecting mental health of individuals (6). Mobility restrictions were frequently lifted during times of non-zero coronavirus disease 2019 (COVID-19) incidence, although evidence suggests this may increase virus transmission (7–8). A deeper understanding of the impact of lifting mobility restrictions can lead to better mitigation policies and enable policymakers to tailor reopening strategies for maximum public health benefits.
We investigated the effects of lifting mobility restrictions in 14 cities in China. We used human mobility data to model the lifting of mobility restrictions and the contrast-specific propensity score methods to control measured confounding. We found that the impacts of increased mobility on COVID-19 epidemiological outcomes could vary by city. Furthermore, we created two city vitality indexes, community connectivity and floating volume, that are useful for informing mobility lifting policies tailored to cities.
The 14 cities are three municipalities, Beijing, Shanghai, and Tianjin; five capital cities, Chengdu, Guangzhou, Hangzhou, Nanjing, and Xiamen; and six typical labor-service importing cities, Dongguan, Foshan, Ningbo, Shenzhen, Suzhou, and Wuxi. Because vaccination may confound the effect of lifting restrictions, we limited our analyses to the first wave of COVID-19, which occurred before vaccines were available.
Epidemiological data, including the laboratory-confirmed cases, recovered cases, and deaths were obtained from the health commissions of 15 city-level administrative divisions (9). Recovery rates were estimated as recovered cases divided by confirmed infections 15 days earlier; death rates were estimated as deaths divided by confirmed infections 14 days earlier (10). Social-demographic data were obtained from the China City Statistical Yearbook 2018 (11) and include number of employees, household population density, housing density, average number of people per household, total number of passengers, gross domestic product (GDP), number of companies, number of hospitals, number of schools, number of hospital beds, and number of physicians.
We used two factor interventions to represent the lifting of mobility restrictions. Factor 1 denoted the lifting the intercity mobility restrictions, and Factor 2 the lifting of the intracity mobility restrictions. We dichotomized continuous intercity and intracity mobility intensities and obtained the two binary factors: 1 for lifting restrictions (low intensities) and 0 for imposing restrictions (high intensities). Intercity mobility intensity was estimated using the Baidu migration data on migration strength across cities. Day 1 was the first reopening day (February 10, 2020) and Daynwas thenth day after February 10, 2020. We estimated the intercity mobility intensity as the proportions of returning population floating on Dayn, i.e., the sum of net flow-in strength from lunar date January 3 to Dayndivided by the net flow-out from the city during the 2020 Spring Festival holiday. Intracity mobility intensity was estimated using the Baidu migration data movement strength within cities, with three-day moving averages to smooth weekend variation. Estimated mobility intensities were dichotomized using their medians across cities and days.
We created two indexes — community connectivity and floating volume — to characterize the vitality of a city. The two indexes capture the floating and fixed aspects of a city. Community connectivity reflects the interactions of floating and fixed populations, and floating volume describes the relative population flow in space. They are defined as follows:
Community connectivity
$$\begin{aligned} & \propto \frac {{\rm{The\;number \;of \;employees}} \times {\rm{The \;size \;of \;household\;population}}}{{\rm{City\;area}}} \\ & ={\rm{The\;number\;of\;employees}}\times {\rm{household\;population\; density}}, \end{aligned}$$ (1) Floating volume
$$\begin{aligned} \propto {\rm{The \;number \;of \;employees }}\times {\rm{City\; area}}\times \frac{{\rm{The\;number\;of\;employees}}}{{\rm{The\;size\; of\; household\; population}}}=\frac{{\rm{The\;number\; of\; employees^2}}}{{\rm{Household \;population\; density}}}. \end{aligned}$$ (2) As shown above, community connectivity is proportional to the number of employees and the household population density in a city. Floating volume is proportional to the number of employees squared and inversely proportional to the household population density.
Baseline covariates include the two indexes, social-demographic characteristics, cluster of first reported cases, numbers of cases, death rates, and recovery rates before reopening.
We adopted the potential outcome framework for causal inferences and considered a city on a particular day as a unit (12). Because the potential outcomes of lifting for a given city on a specific day may not be independent of the outcomes for the same city on previous days, the conventional stable unit treatment value assumption is not applicable (13). We therefore imputed potential outcomes based on a short timeframe using the autoregressive integrated moving average model (14). We used the contrast-specific propensity score approach to balance groups of units for comparison, using the subclassification method that grouped units into five classes (15). We estimated the effects of lifting intercity mobility restrictions alone, intracity mobility restrictions alone, and the two restrictions simultaneously, within and across classes. The average effect across classes was calculated as the weighted average of causal effects across the five subclasses, with weights given by the proportions of samples within classes over the size of full samples. All the analyses were conducted using R (version 4.0.3, R Foundation for Statistical Computing, Vienna, Austria).
The three types of lifting — lifting intercity restrictions alone, intracity restrictions alone, and intercity and intracity restrictions simultaneously — increased recovery rates by 0.24 [95% confidence interval (CI): 0.23–0.26], 0.20 (95% CI: 0.19–0.22), and 0.21 (95% CI: 0.19−0.23), respectively. The three liftings increased death rates but with smaller values and wider confidence intervals, 0.09×10⁻²(95% CI: 0.07×10⁻²−0.11×10⁻²), 0.03×10⁻²(95% CI: 0.02×10⁻²−0.05×10⁻²) and 0.04×10⁻²(95% CI: 0.02×10⁻²−0.05×10⁻²). Similarly, the three types of lifting increased cases with wider confidence intervals, 3.49 (95% CI: 2.87−4.12), 2.50 (95% CI: 2.12−2.88), and 2.22 (95% CI: 1.89−2.55). The effects of lifting on cases and death rates had large ratios of variances to means, suggesting that these effects were likely to be heterogeneous across cities.
We found that the effects of the three types of lifting on death rates varied greatly across the five classes (Figures 1–3). For example, lifting intercity restrictions reduced the death rates for cities in Class 1 (mean −0.02×10⁻², 95% CI: −0.03×10⁻²to −0.01×10⁻²) while significantly increased death rates for cities in Class 4 and 5 (Figure 1A). Lifting of intracity restrictions also showed heterogeneous effects across classes. While the liftings significantly increased death rates for cities in Class 2 by 0.06×10−2(95% CI: 0.02×10⁻²–0.11×10⁻²), it did not impact death rates for cities in Class 5 (Figure 2A). Note that Class 5 when investigating the contrast with lifting intra-city restrictions (Figure 2A) and when investigating the contrast with lifting intercity restrictions (Figure 1A) may consist of different cities because classes for the different contrasts were constructed under different contrast-specific propensity scores. Finally, simultaneous lifting of intercity and intracity showed zero effect for cities in Class 3 and 4 but had an increase of 0.07×10⁻²(95% CI: 0.03×10⁻²to −0.11×10⁻²) in death rates for cities in Class 2 (Figure 3A). The increases in cases showed high variation across classes of cities, though all three types of lifting increased cases significantly.
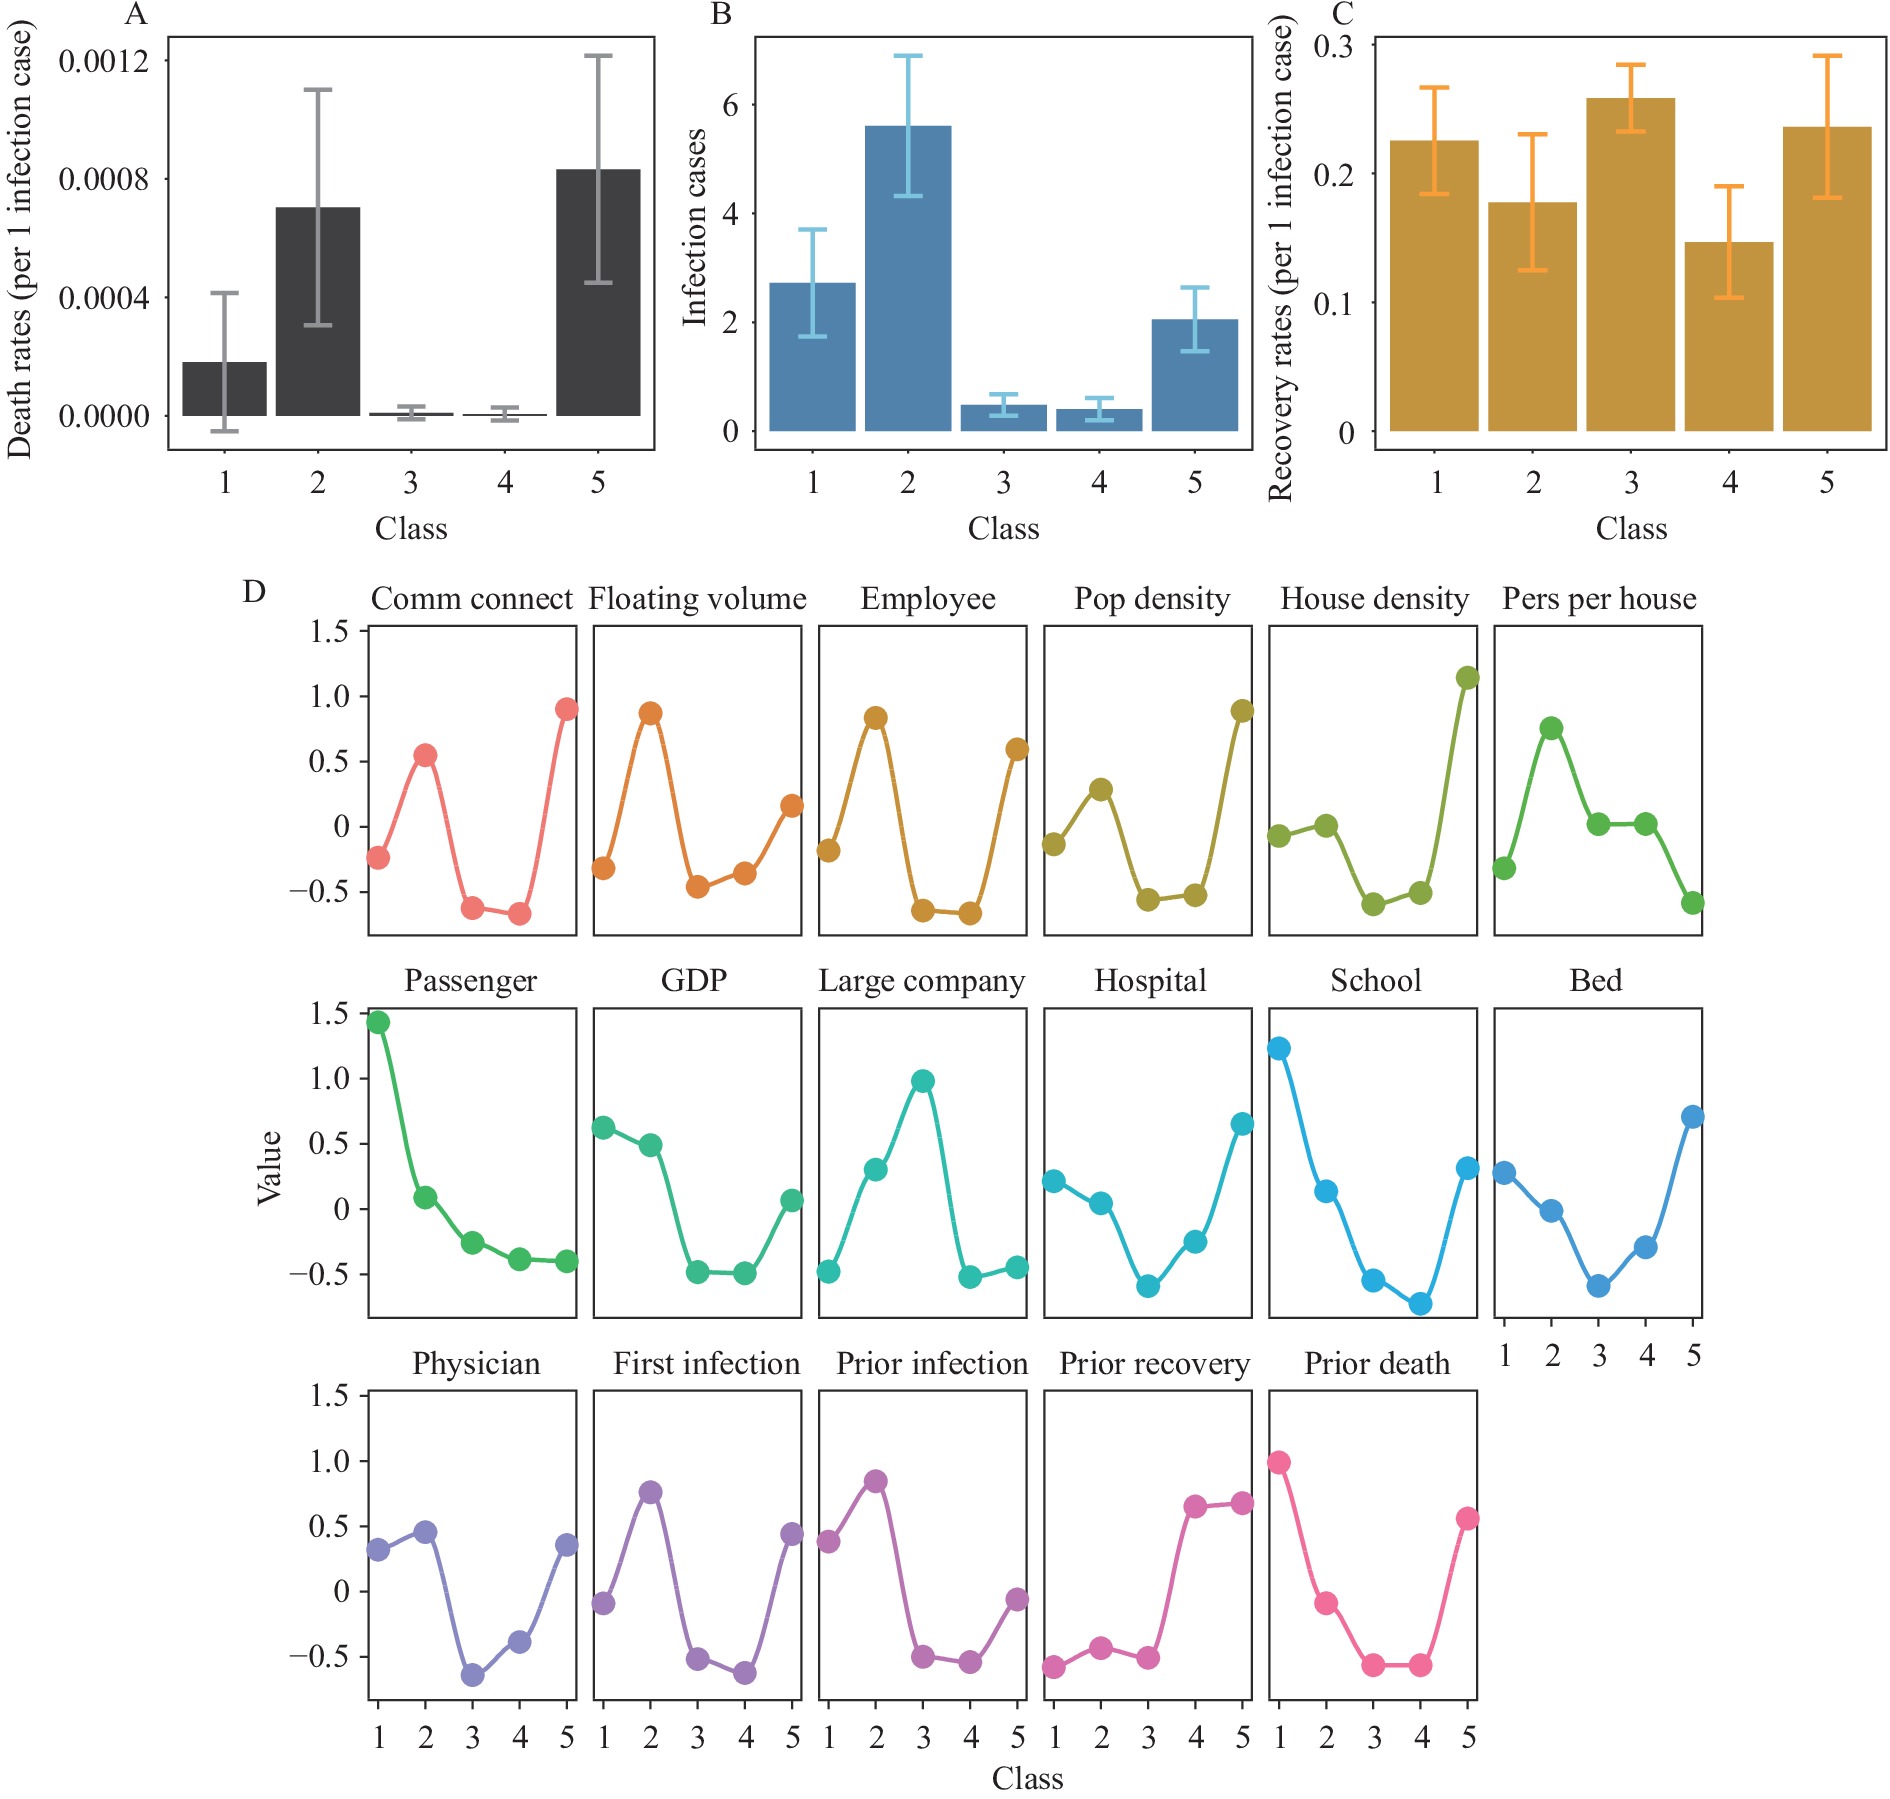
 Figure 1.
The within-class effects (means and 95% confidence interval) of lifting intercity mobility restrictions. (A) Effects in death rates for Class 1–5; (B) Effects in recovery rates for Class 1–5; (C) Effects in infection cases for Class 1–5; (D) Standardized means of city characteristics for Class 1–5.
Note: “Comm connect,” the index of community connectivity; “Floating volume,” the index of floating volume; “Employee,” the number of employees; “Pop density,” the household population density; “House density,” the house density; “Pers per house,” the number of persons per house; “GDP,” the gross domestic product; “Large company,” the number of large-size companies; “Hospital,” the number of hospitals; “School,” the number of schools; “Bed,” the number of hospital beds; “Physician,” the number of physicians; “First infection,” the number of first reported infections; “Prior infection,” “Prior recovery,” and “Prior death,” represent the infection cases, recovery rates, death rates before the effective date of the return to work order. Figure 2.
The within-class effects (means and 95% confidence interval) of lifting intracity mobility restrictions. (A) Effects in death rates for Class 1–5; (B) Effects in recovery rates for Class 1–5; (C) Effects in infection cases for Class 1–5; (D) Standardized means of city characteristics for Class 1–5.
Note: “Comm connect”, the index of community connectivity; “Floating volume”, the index of floating volume; “Employee”, the number of employees; “Pop density”, the household population density; “House density”, the house density; “Pers per house”, the number of persons per house; “GDP”, the gross domestic product; “Large company”, the number of large-size companies; “Hospital”, the number of hospitals; “School”, the number of schools; “Beds”, the number of hospital beds; “Physicians”, the number of physicians; “First infection”, the number of first reported infections; “Prior infection”, “Prior recovery” and “Prior death,” represent the infection cases, recovery rates, death rates before the effective date of the return to work order. Figure 3.
The within-class effects (means and 95% confidence interval) of simultaneously lifting intercity and intracity mobility restrictions. (A) Effects in death rates for Class 1–5; (B) Effects in recovery rates for Class 1–5; (C) Effects in infection cases for Class 1–5; (D) Standardized means of city characteristics for Class 1–5.
Note: “Comm connect,” the index of community connectivity; “Floating volume,” the index of floating volume; “Employee,” the number of employees; “Pop density,” the household population density; “House density,” the house density; “Pers per house,” the number of persons per house; “GDP,” the gross domestic product; “Large company,” the number of large-size companies; “Hospital,” the number of hospitals; “School,” the number of schools; “Bed,” the number of hospital beds; “Physician,” the number of physicians; “First infection,” the number of first reported infections; “Prior infection,” “Prior recovery,” and “Prior death,” represent the infection cases, recovery rates, death rates before the effective date of the return to work order.To identify the factors that drove differences in deaths and cases across classes, we calculated the correlations between within-class standardized covariate means (Figures 1–3D) and the within-class effects. We found that community connectivity was highly correlated with the effects on death, regardless of the type of lifting. Pearson correlation coefficients between the two variables were 0.93 (P<0.05), 0.99 (P<0.05), and 0.99 (P<0.05) for lifting the intercity restrictions, the intra-city restrictions, and the two restrictions simultaneously. Floating volume was moderately correlated with the effects in cases, with Pearson correlation coefficients of 0.95 (P<0.05), 0.82 (P=0.08), and 0.90 (P<0.05) for the three types of lifting.
-
Although lifting mobility restrictions increased cases and death rates for an average city, the effects varied greatly across cities. Death rates in certain cities even declined as a consequence of lifting. Nonetheless, the liftings showed similar increases in recovery rates across cities, regardless of the types of lifting. We created two indexes — community connectivity and floating volume — as predictors of the variations in effects across cities for death rates and infections, respectively.
Community connectivity is proportional to the number of employees and the household population density in a city. The lower the community connectivity, the smaller the increase in death rate. When cities had fewer employees and lower population densities, all three types of lifting would not impact or even reduce death rates while increasing recovery rates (e.g., Class 5 inFigure 1, Class 5 inFigure 2, and Class 4 inFigure 3). For two cities with the same population density, the one with fewer employees would have smaller increases in death rates (e.g., Class 3 versus 4,Figure 1A). Furthermore, given the same number of employees, cities with lower population densities would experience small or negligible increases in death rates after lifting restrictions (e.g., Class 4 versus 5, and Class 1 versus 2,Figure 1A).
Floating volume is proportional to the number of employees squared and inversely proportional to the household population density. High floating volume predicts large increases in infections upon lifting restrictions. As such, cities with both a large number of employees and a low population density would have a large increase in infections when lifting restrictions (e.g., Class 4 inFigure 1). Given the same population density, cities with more employees would have larger increases in infections (e.g., Class 3 versus 4,Figure 1B). Of note, the number of employees plays a dominant role in determining the degree of increase because the floating volume is proportional to the square of the number of employees. Thus, cities with high population densities could still experience large increases in infections if the number of employees is large (e.g., Class 2 inFigure 2).
Finally, high community connectivity and floating volume predict large increases in both deaths and infections upon lifting restrictions (e.g., Class 2 inFigures 2and3).
Our results highlight the need for city-specific lifting strategies in China. Policies targeting the two indexes need to accompany the lifting of mobility restrictions to control death rates and infections. Cities with high community connectivity should consider flexible working strategies (e.g., rotating schedules, shift work, and job-sharing) and provide less dense living places for floating populations. Cities with high floating volume and community connectivity should ensure sufficient healthcare resources to care for severely ill patients prior to lifting mobility restrictions.
To properly interpret our findings, it is important to consider the study’s limitations. While we have reduced confounding due to vaccination by restricting the study to the first wave of the COVID-19 pandemic, which occurred before COVID-19 vaccines were available, there may exist confounding due to urbanization. We used the number of employees, large-size companies, hospitals, hospital beds, and physicians as proxies for urbanization, but these factors may not fully capture urbanization. Second, since the SARS-CoV-2 strain circulating during the first wave of the COVID-19 pandemic had slower transmission and higher infection fatality rates than the Omicron variant, our estimated effects cannot be directly extrapolated to the current situation. However, because the variants are transmitted in similar ways, the factors for predicting effect differences are likely to remain the same. Furthermore, the effects of lifting restrictions may be influenced by age distribution and presence of chronic health conditions in citizens. More sophisticated indexes that are able to account for these features are needed. Finally, future research could continue to explore the causal pathways of how increased mobility affects epidemiological outcomes. For example, increased access to ventilators and other medical resources as well as food supplies, which the lifting of mobility restrictions may influence, could play a mediator role.
Our study provides a unique perspective on factors that drive the heterogeneous effects of lifting mobility levels in cities. A comprehensive understanding of these factors is crucial so cities can prepare properly for lifting their mobility restrictions.
-
No conflicts of interest.
HTML


| Citation: |

|